A Brief Guide to Using a Support and Resistance Crypto Trading Strategy
Before we dive in with how to use support and resistance in crypto, let’s start with a definition and a brief exploration of why they are key to a trader’s understanding of current market conditions.
Defining Support and Resistance in Crypto
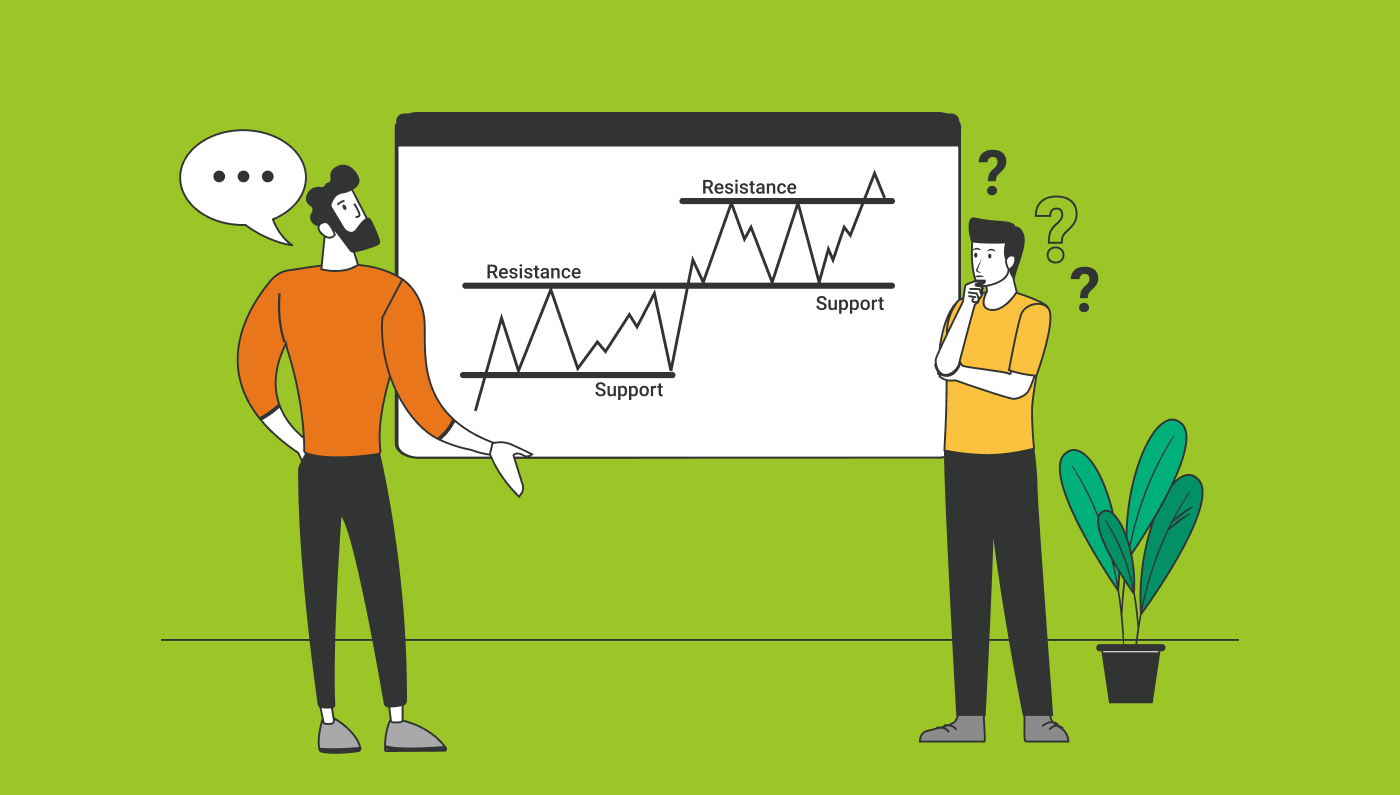
Support and resistance lines are used in technical analysis. They provide key tools for assessing the supply and demand for an asset, and for reflecting market trends. They represent the current upper and lower price limits for an asset and on a graph, they appear as horizontal lines.
The support level is the price at which demand picks up and a cryptocurrency bounces back after a drop. It is the price at which buyers will become willing to purchase the cryptocurrency and sellers will become reluctant to part with their coins. In a scenario where the support level has been breached, and prices have kept dropping, market participants are in for a stronger bear trend.
In contrast the resistance level is the point at which the price stops rising, taking a dip. Demand drops off and buyers are less eager to buy the cryptocurrency. It is the maximum price market participants are willing to pay for the cryptocurrency in current conditions. But for those who already own the asset, it is an attractive price at which to sell. In a scenario where the price is rallying and the resistance level hasn’t held, market participants are in for a bull trend.
A prior support level can become a new resistance level if the price drops significantly, and a prior resistance level can become a new support line if the price rallies.
In a bull run, support and resistance lines point upwards, each peak higher than the previous one, while the reverse is true in a bear market, with each trough lower than the last.
Using Support and Resistance Zones in a Crypto Trading Strategy
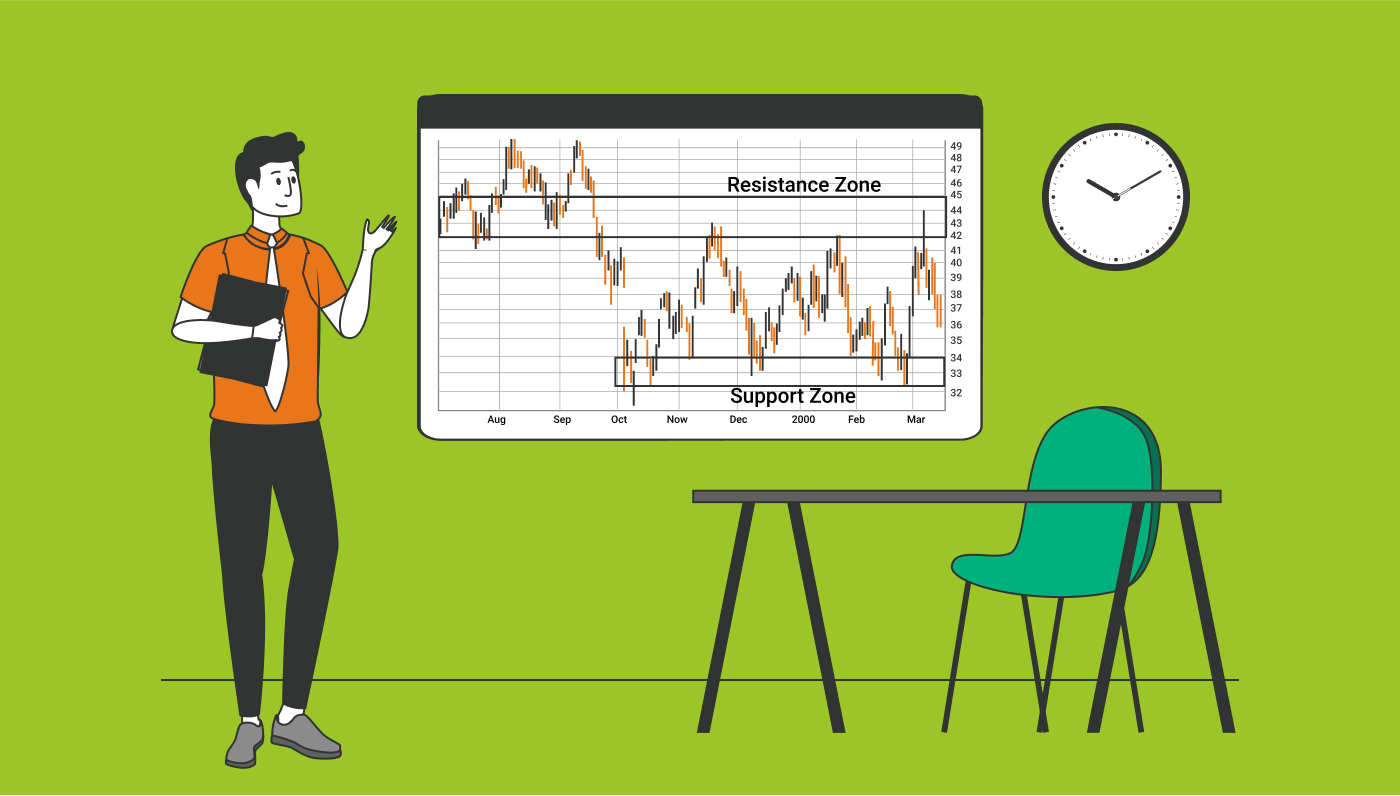
An asset will usually be traded above the support level and below the resistance level. However, in the highly volatile digital currency markets it is a good idea to set the support and resistance levels in crypto graphs as zones instead of lines.
If it were possible to precisely pinpoint a resistance or support price, then a line would be more than sufficient, and every market participant would know exactly when to enter or exit a position. However, zones are the most accurate pricing we can achieve in the dynamic crypto markets. There is a range of prices around which an asset will bounce, touching on, breaking through and falling back from them a number of times until a major reversal takes place.
When performing technical analysis, the previous lows are used to plot a support zone, and for a resistance zone, the previous highs are used as the guide. The aim is to buy just above the support in an uptrend and sell close to the resistance in a downtrend. It is advisable to use support and resistance levels as one indicator among others to confirm a trend and not use them as the sole factor in your decision making.
Plotting Support and Resistance Lines
In order to map support and resistance levels on a chart, you need to identify the highs and lows for the asset price going back a little way and drawing lines at these levels. By examining the recent price action for the cryptocurrency around these pointsyou will be able to identify if there is a current market trend. By linking these highs and lows to create horizontal lines you will be able to identify support and resistance zones.

When plotting support and resistance levels you should always remember to keep in mind that a support level can turn into the next resistance level, and vice versa.
Using Automated Trading Tools
It is not actually necessary to map out support and resistance levels by yourself, as there are plenty of automated tools that will perform the analysis for you. However, with the extreme volatility of the crypto markets, whether you are trading manually or using a bot, there is always a significant degree of risk involved. One way to mitigate that risk is with crypto arbitrage.
Crypto arbitrage works by taking advantage of temporary price inefficiencies – brief windows in which a coin is available across multiple exchanges at different prices at the same time. A variety of factors can cause these inefficiencies, such as a disparity in trading volume between exchanges of different sizes.
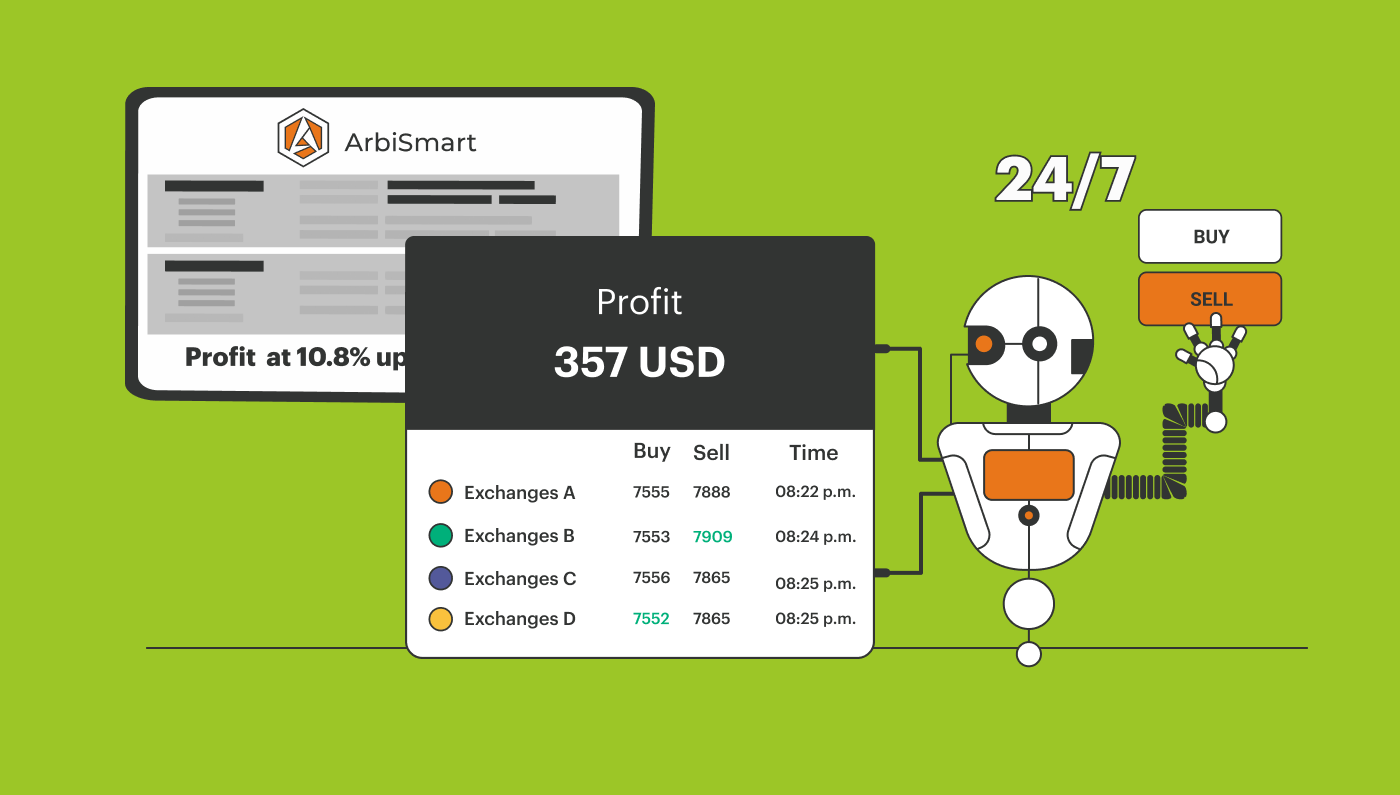
At ArbiSmart, our fully automated crypto arbitrage platform invests on your behalf, generating a steady, reliable return of up to 45% a year, even when the market behaves unpredictably.
ArbiSmart’s algorithm scans nearly 40 exchanges simultaneously 24/7 looking for price inefficiencies on hundreds of digital assets. It then buys the coin on the exchange where it is cheapest, before instantly selling it for a profit on the exchange where the price is the highest.
Since price inefficiencies will continue to occur with the same consistency even if the market crashes, ArbiSmart provides a valuable hedge against a sudden unexpected shift in direction.
Explore crypto arbitrage more thoroughly, or check out the rest of the ArbiSmart blog to find out about a wide range of crypto- connected topics.