A Brief Guide to Technical Analysis for Crypto Trading
When trading cryptocurrency, a high-risk, exceptionally volatile asset, in-depth research and up-to-the-minute insights are required to ensure that you are making exactly the right move at the right time. In this beginner’s guide to technical analysis we will look at what technical analysis is and how cryptocurrency indicators can be used to make informed market decisions.
What is Technical Analysis?

Technical analysis is a method of analyzing the market. It looks at historic price movements as a means of identifying patterns and predicting future market activity. This approach examines price statistics, using a variety of technical analysis tools, to reach conclusions about the trajectory of a given asset.
Technical analysis is based on a few basic premises, with one of the most important being that prices move according to trends. It is also based on the theory that price moves will occur in response to changes in supply and demand. Another assumption behind technical analysis is that market psychology will drive prices to follow predictable patterns.
Technical indicators for trading cryptocurrencies are the tools used by the investor to identify trends and predict the future direction of a coin. Let’s now examine some of the most popular technical indicators for cryptocurrency trading, from Fibonacci Retracements to Moving Averages and Relative Strength Indicators (RSI’s):
Fibonacci Retracement
One of the best chart indicators for cryptocurrency is Fibonacci Retracement, which is a method for determining support and resistance levels. The support level is the price below which the asset does not fall, for a given period, based on current demand, while the resistance level is the upper limit, above which the asset doesn’t rise.
Fibonacci Retracement shows these upper and lower limits, using Fibonacci ratios (23.6%, 38.2%, 50%, 61.8%, and 100%) to draw horizontal lines that divide the distance between the price support and resistance levels.
Fibonacci Retracements are a great cryptocurrency buy and sell indicator as they will show you the highest and lowest prices within your chosen time frame. This is useful for determining when to enter or exit a trade, since once the price comes close to the retracement lines you will get a sense of the trajectory of the coin. It will either spring back from the line or cross through it to reach a new resistance or support level.
Moving Averages
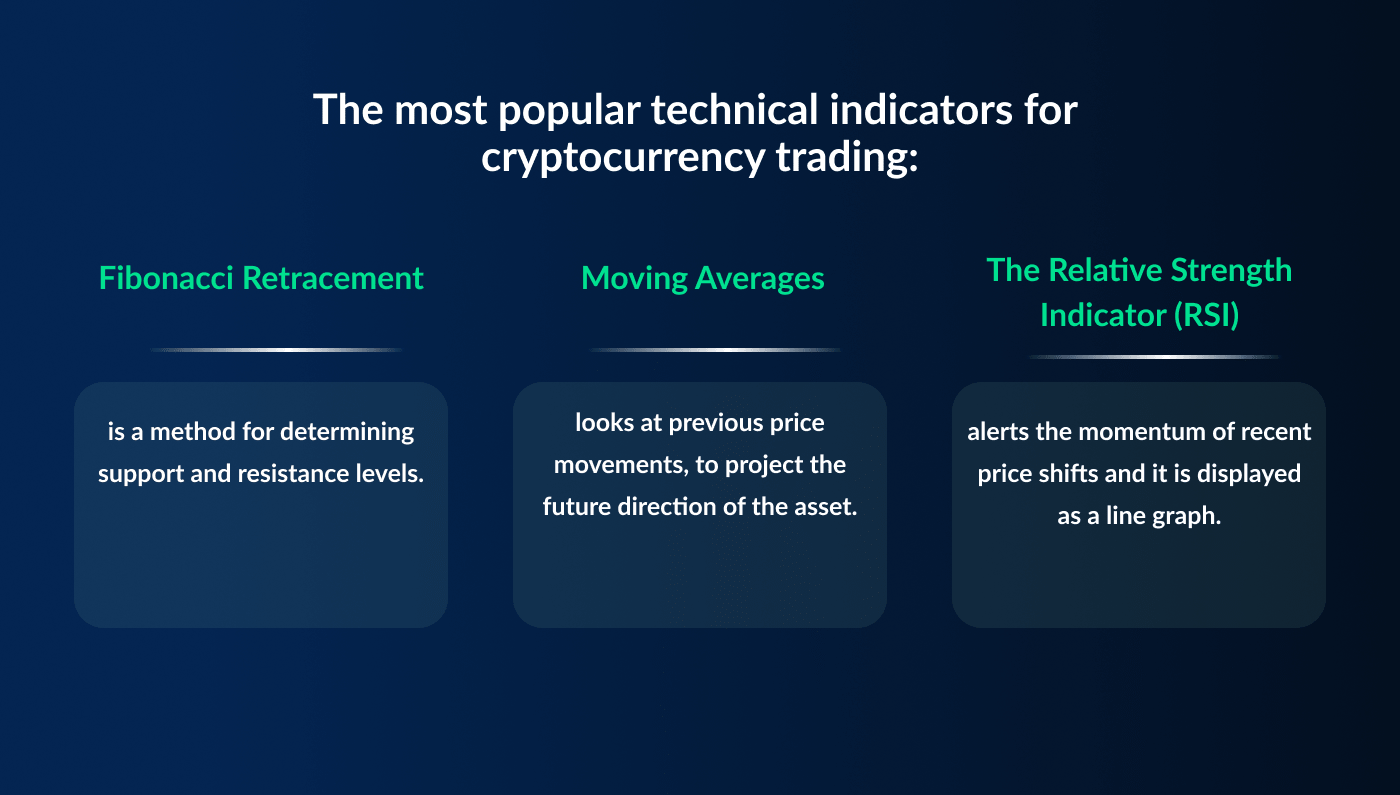
Of all the trend following cryptocurrency indicators one of the most popular is Moving Averages, which looks at previous price movements, to project the future direction of the asset.
This is one of the most useful cryptocurrency indicator alerts, comparing the current price of your chosen crypto asset to an average of its past prices over a given time frame. Understanding Moving Averages on a price chart involves looking at the average price of an asset over set time periods such as 50, 100 or 200 days. By plotting the moving averages of two different time intervals on a single crypto price chart and seeing how they interconnect you can identify a shift in momentum for your chosen cryptocurrency.
The Moving Average anticipates trends based on prior activity in two different ways:
The Simple Moving Average, or SMA for short, is one of the most straightforward technical indicators for trading cryptocurrencies. It is calculated by finding the average of the previous prices for the asset and then dividing this by the number of time frames.
The Exponential Moving Average, or EMA, is similar to the SMA, but rather than giving all the previous time frames the same importance, it prioritizes price data from more recent periods, giving them greater weight in the calculation of the moving average.
The Relative Strength Indicator (RSI)
Another of the most useful technical indicators for trading cryptocurrencies is the Relative Strength Indicator (“RSI”).
This cryptocurrency indicator alerts you to the momentum of recent price shifts and it is displayed as a line graph that oscillates between two extremes on a scale from O at one end, and 100 at the other.
To identify a trend, you look at points where the center line (50) is crossed. If the line crosses the 50 mark on an upward trajectory the trend is bullish and if it crosses in a downward direction, then the trend is bearish.
This is among the most valuable cryptocurrency indicators because it not only shows trend directions, but also provides data about reversals. If the RSI value is below 30, the coin has been under-valued and this suggests a market adjustment where the price will correct upwards. In contrast, if the RSI exceeds 70 then the coin is over-valued, indicating that there will be a correction and the price will pull-back and drop in price.
A Safer, Easier Approach

Interpreting technical indicators for trading cryptocurrencies can be incredibly complex. If this all feels like too much hard work and simply too complicated, there is an easier and also far less risky way to get a slice of the crypto market action.
Here at ArbiSmart, we offer an EU licensed, automated crypto arbitrage platform, where all you need to do is sign up, deposit funds and we do the rest.
Crypto arbitrage is one of the lowest-risk forms of investing as it is not vulnerable to crypto market volatility. Instead, it makes a profit from temporary price inefficiencies. These are short windows of just a few minutes when a cryptocurrency is available at different prices at the same time, across exchanges.
The ArbiSmart platform monitors hundreds of cryptocurrencies across 35 exchanges, 24/7, to find price inefficiencies. It will buy the coin on the exchange where the price is lowest and then, instantly, sell it on the exchange where the price is highest to make a profit, before the temporary price inefficiency resolves itself, generating profits of up to 45% a year.
In this way, you are earning huge passive profits without lifting a finger. You don’t need to have market experience, or hours of free time to spend researching, identifying patterns, tracking market movements and executing trades, as the ArbiSmart automated crypto arbitrage platform does it all for you, while you get on with your day.
Technical analysis is a valuable tool that can help you make more informed market decisions. However, while cryptocurrency charts with indicators are useful, there is no fool-proof formula that can tell you exactly when the price of your chosen asset will move and in what direction. This means that there is always an element of risk when trading on the highly volatile and unpredictable crypto markets. For this reason, a lower-risk approach like crypto arbitrage, may be the safest and smartest means of exploiting the revenue potential of this exciting asset class.
Find out more about arbitrage, or learn more about the crypto space in general, by checking out the ArbiSmart blog.